Despite stock market volatility in June, net inflows into equity mutual funds (MFs) during the month jumped 26% over May to almost Rs 29,000 crore as investors poured money into mid- and small-cap funds ahead of other types of schemes, according to data released by the Association of Mutual Funds in India (Amfi), the fund industry trade body.
SIP Flows and Retail Participation
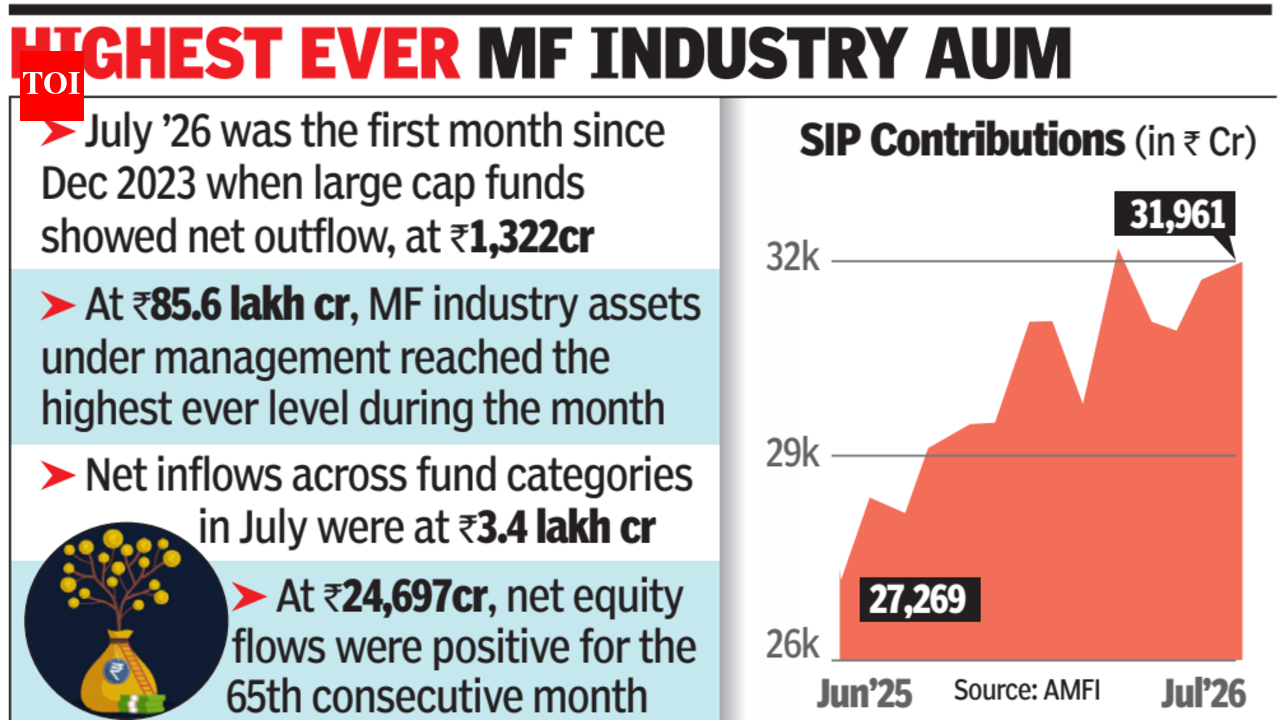
Gross flows through the systematic investment plan (SIP) route also jumped to nearly Rs 31,800 crore, a three-month high figure. The highest gross monthly inflow through the SIP route at Rs 32,087 crore was recorded in March this year. This June marked the 64th consecutive month of positive equity fund flows, starting from March 2021, Amfi said in a release.
According to Venkat Chalasani, chief executive of Amfi, the June data is a sign of growing investor confidence and the increasing adoption of disciplined, long-term investing through the mutual fund route. Retail AUM, which includes total worth of assets under equity, hybrid and solution-oriented schemes, stood at Rs 49.4 lakh crore, up from Rs 47.9 lakh crore in May.
Mid-Cap and Small-Cap Inflows
Mid-cap funds recorded a net inflow of Rs 6,090 crore while the corresponding figures for small-cap and flexi cap funds were Rs 5,602 crore and Rs 5,231 crore, respectively. "Investors weren't fleeing equities, they were rotating out of diversified/value mandates and into direct mid- and small-cap conviction bets during the (market's) dip," said Viraj Gandhi, CEO of Samco Mutual Fund.
Debt Category Outflows and Gold ETFs
During the month, the debt category witnessed a Rs 1.1 lakh crore net outflow as quarter-end considerations by corporates, such as advance tax payments, prompted those entities to withdraw funds from overnight, liquid and ultra short duration funds, industry players said.
June data also showed strong inflows into gold ETFs, with net inflow at Rs 3,443 crore, compared to a net outflow figure of Rs 725 crore the previous month.
Industry Assets Under Management
At an overall level, the fund industry's net assets under management in June stood at Rs 82.2 lakh crore, up marginally from Rs 81.6 lakh crore in May.
| Category | June Net Flow (Rs crore) | Previous Month Net Flow (Rs crore) |
|---|---|---|
| Equity MF (net) | ~29,000 | ~23,000 (estimated based on 26% jump) |
| SIP (gross) | ~31,800 | Three-month low (prior) |
| Mid-cap funds | 6,090 | — |
| Small-cap funds | 5,602 | — |
| Flexi cap funds | 5,231 | — |
| Debt category | -1,10,000 (outflow) | — |
| Gold ETFs | 3,443 | -725 (outflow) |
Note: Some prior month figures not explicitly provided in the source.
Implications for Institutional Investors
For CFOs and treasury professionals tracking India's capital markets, the sustained equity inflows signal robust domestic retail participation, which can support market valuations and reduce dependence on foreign portfolio investment. However, the Rs 1.1 lakh crore debt outflow highlights quarter-end liquidity management by corporates, a recurring pattern that may affect short-term yields on money market instruments. The surge in gold ETF inflows suggests a shift toward safe-haven assets amid global uncertainty, potentially impacting the cost of hedging for importers. These trends warrant monitoring for emerging market asset allocation decisions.
Sources: