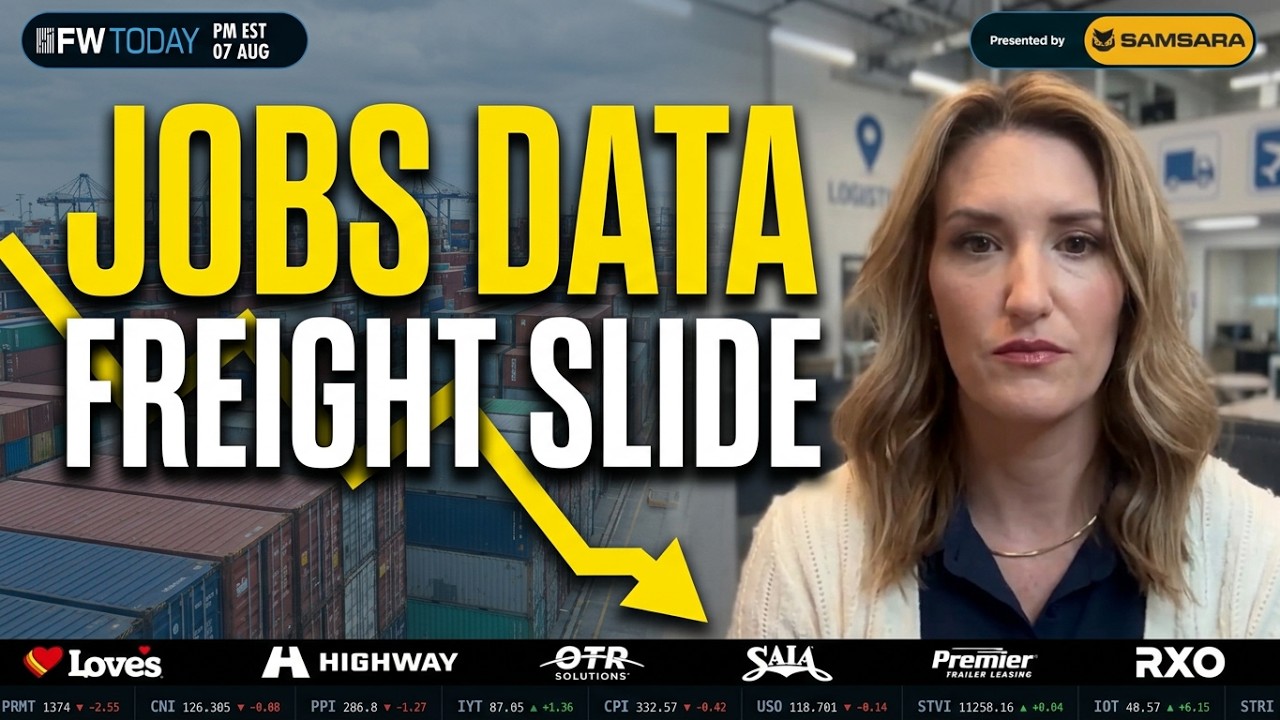
U.S. nonfarm payrolls fell by 23,000 in July, and freight volumes are sliding on the jobs miss — yet carriers still hold pricing power, according to FreightWaves' analysis of the July jobs report and live SONAR data. The report, released by the Bureau of Labor Statistics on Friday, Aug. 7, came in far below consensus expectations of 83,000 to 95,000 job gains, and downward revisions to May and June removed another 103,000 jobs from the combined count.
What the Jobs Numbers Mean for Freight
The unemployment rate ticked down to 4.1%, but for the wrong reason: labor force participation fell to 61.4%, a five-year low, meaning workers left the workforce rather than found jobs, FreightWaves reported. The freight-relevant losses were concentrated in retail trade, down 19,000 jobs, and warehousing clubs and general merchandise, down 21,000. "Those are shippers generating truckload freight," said the FreightWaves analyst presenting the SONAR update. Transportation and warehousing employment was flat — neither adding nor shedding workers — mirroring what real-time SONAR data show on volumes and capacity.
SONAR Data: Volumes Slide, Pricing Power Holds
The SONAR Truckload Rejection Index stood at 13.6% as of the update, down from a peak of 17.9% in early June, and the SONAR Truckload Volume Index retreated from its mid-July peak to roughly 11,258. The analyst cautioned against reading the rejection slide as a fundamental shift in market power, noting the current cycle is driven by a lack of capacity, not weakening demand.
The FreightWaves analyst said:
I wouldn't overread the rejection slide as a market flip to shippers by any means. The PPI still clearly says that carriers have the leverage. It's just softened a bit off of that really high recent number from early June.
The SONAR Freight Pricing Power Index (FWPI) came in at 72 for the week, down from a mid-July peak of 79 but still firmly in carrier-favorable territory. Contract rates continued to rise near their recent highs even as spot rates dipped slightly versus the 30-day average, narrowing the spot-to-contract spread, according to FreightWaves. Rail volumes remained near the top of their five-year range, providing additional support for the carrier-favorable reading.
| Metric | Latest reading | Peak / comparison |
|---|---|---|
| U.S. nonfarm payrolls, July | -23,000 | Consensus: +83,000 to +95,000 |
| May–June payroll revisions | -103,000 combined | Downward revision |
| Unemployment rate | 4.1% | Down |
| Labor force participation | 61.4% | Five-year low |
| SONAR Truckload Rejection Index | 13.6% | 17.9% peak in early June |
| SONAR Truckload Volume Index | ~11,258 | Off mid-July peak |
| Freight Pricing Power Index | 72 | 79 peak in mid-July |
| ISM Purchasing Managers Index | 55.6 | Highest since May 2022 |
Manufacturing Offers a Counterweight
Manufacturing data pull against the soft freight and labor numbers, FreightWaves reported. The ISM Purchasing Managers Index hit 55.6 in July, its highest reading since May 2022 and the seventh consecutive month of expansion. New orders and backlogs accelerated, and manufacturing added jobs for the first time in 33 months. The analyst said industrial activity should eventually pull freight demand higher — unless shippers are still burning through existing inventory rather than placing fresh orders.
Fuel, Regional Capacity, and the Outlook
Geopolitical risk adds further uncertainty. DOE diesel prices rose 16.8% month over month amid renewed conflict in the Middle East, raising questions about whether carriers can continue passing higher fuel costs through to all-in spot rates given the capacity environment. Regionally, capacity loosened most quickly in Atlanta and El Paso, while tender rejections remained elevated and actually increased over the prior few days across parts of the Midwest, with Green Bay standing out. The analyst summarized the setup as three economic forces — a weakening labor market, accelerating manufacturing, and stubborn inflation — pulling in different directions, with the Pricing Power Index sitting at their intersection.
Watch List
- Freight Pricing Power Index: 72 for the week, down from 79 in mid-July — watch whether it holds in carrier-favorable territory.
- Truckload Rejection Index: 13.6%, down from the 17.9% early-June peak — monitoring whether the slide continues.
- Contract vs. spot spread: Contract rates near highs, spot rates dipping slightly versus the 30-day average — the narrowing spread is a margin signal.
- Diesel prices: DOE diesel up 16.8% month over month amid Middle East conflict — fuel-cost pass-through depends on the capacity environment.
- Manufacturing new orders: ISM PMI at 55.6 with accelerated new orders and backlogs — fresh orders versus inventory burn-in will determine if industrial activity lifts freight demand.
Sources: