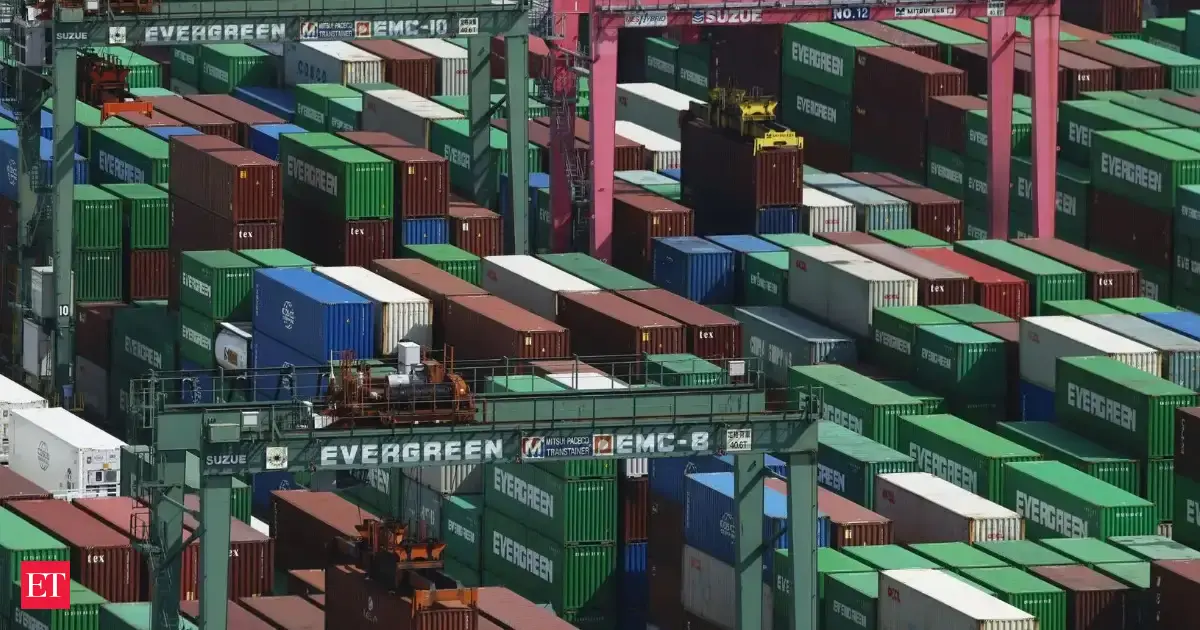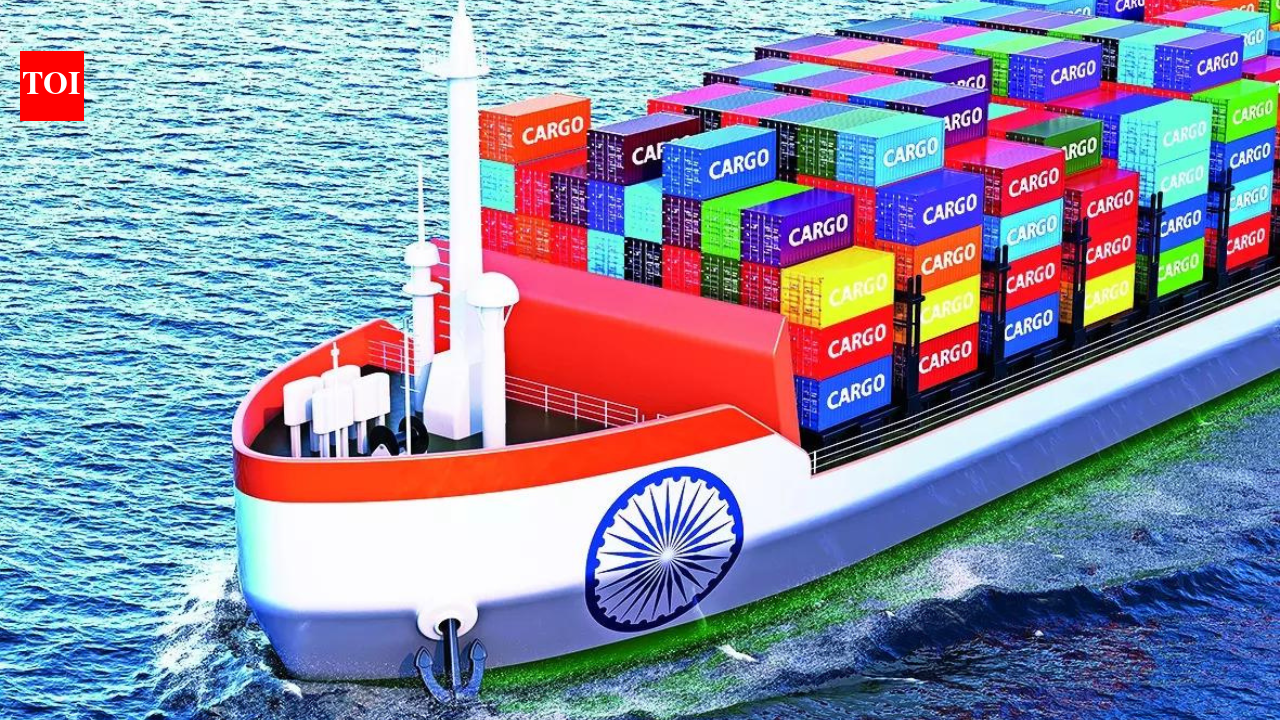
India’s goods exports surged 18% in May to a record $45.2 billion, driven by higher oil prices and restoration in supply chains, while imports rose 20.5% to a seven-month high of $73.4 billion, widening the trade deficit to $28.2 billion, according to data released by the commerce ministry.
Record Exports Driven by Oil and Engineering Goods
The export growth was led by engineering goods, which rose 24.5% to $12.3 billion, and oil products, which jumped 55% to $8.4 billion. Non-oil exports increased 12% to $36.8 billion. Exports to West Asia also stabilised, reaching $5.3 billion in May compared to $5.4 billion a year ago, as both sides opened new trade routes.
Commerce secretary Rajesh Agrawal said, “We have carried forward the momentum seen in April and we have maintained it in May... We should have a good June with things getting back to normal.” He also noted that the reopening of the Strait of Hormuz is expected to reduce cost pressure on Indian businesses.
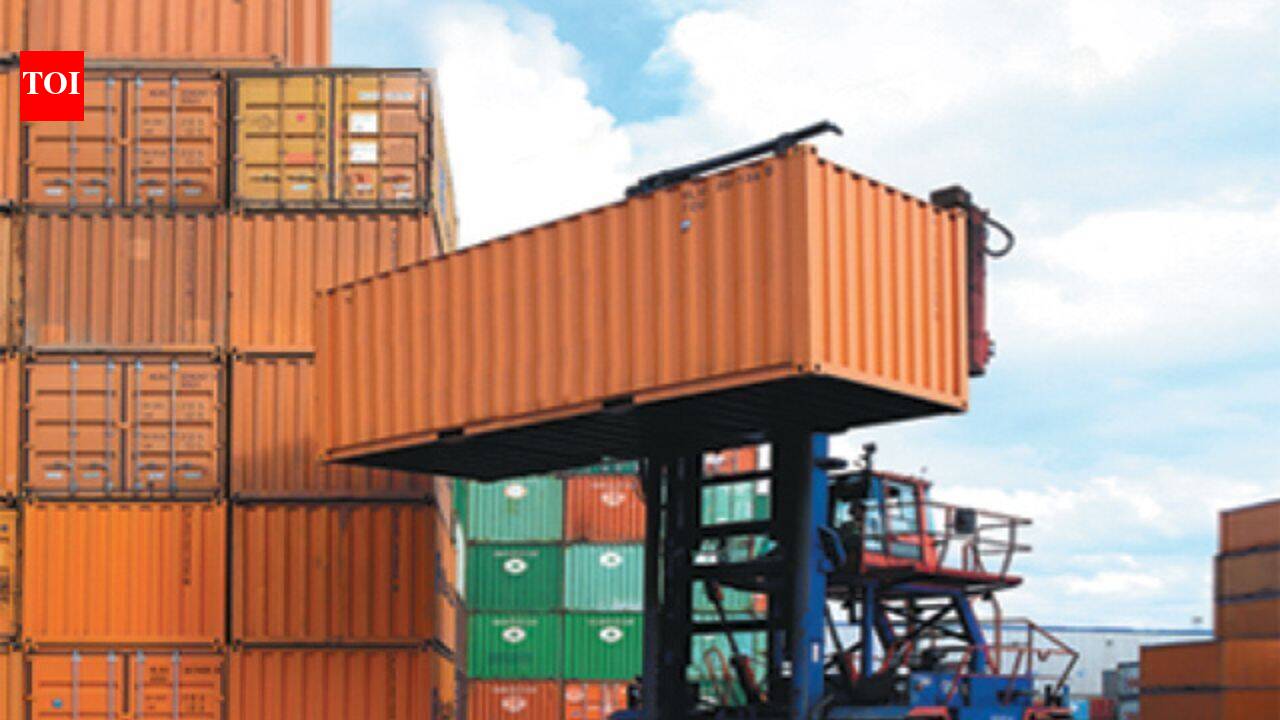
Imports Hit by Strait of Hormuz Closure
On the import side, the closure of the Strait of Hormuz led to a near 18% fall in imports through that route to $10.7 billion in May, though this was a significant improvement from the 52% decline seen in March. The disruption in supply of oil, gas, fertiliser, and petrochemicals was a key reason for the decline.
Oil imports rose 53.8% to $22.8 billion due to higher crude prices. Gold imports increased 34% to $3.4 billion, while silver imports plummeted 87% to $75.6 million. Electronics imports rose 36% to $12.3 billion. The impact of the West Asia conflict was visible in chemicals, where imports dropped 64% to $1.3 billion, while fertiliser shipments increased 28% to $880 million.
Services Trade Surplus
On the services front, exports are estimated to have increased 13% to $36.8 billion in May, while imports rose 14.4% to $19.1 billion, resulting in a surplus of $17.7 billion.
Key Trade Data for May 2026
| Indicator | Value | Change (YoY) |
|---|---|---|
| Goods Exports | $45.2 billion | +18% |
| Goods Imports | $73.4 billion | +20.5% |
| Trade Deficit | $28.2 billion | – |
| Services Exports | $36.8 billion | +13% |
| Services Imports | $19.1 billion | +14.4% |
| Services Surplus | $17.7 billion | – |
Product-wise Export Performance
- Engineering goods: $12.3 billion (+24.5%)
- Oil products: $8.4 billion (+55%)
- Non-oil exports: $36.8 billion (+12%)
- Exports to West Asia: $5.3 billion (vs. $5.4 billion a year ago)
Product-wise Import Performance
- Oil imports: $22.8 billion (+53.8%)
- Gold imports: $3.4 billion (+34%)
- Silver imports: $75.6 million (-87%)
- Electronics imports: $12.3 billion (+36%)
- Chemicals imports: $1.3 billion (-64%)
- Fertiliser imports: $880 million (+28%)
"We have carried forward the momentum seen in April and we have maintained it in May... We should have a good June with things getting back to normal." — Rajesh Agrawal, Commerce Secretary
The trade data underscores the resilience of India’s export sector despite global headwinds, while import growth reflects strong domestic demand and higher commodity prices. Traders and customs brokers should note the evolving trade routes and the impact of geopolitical developments on shipping and costs.
Sources: