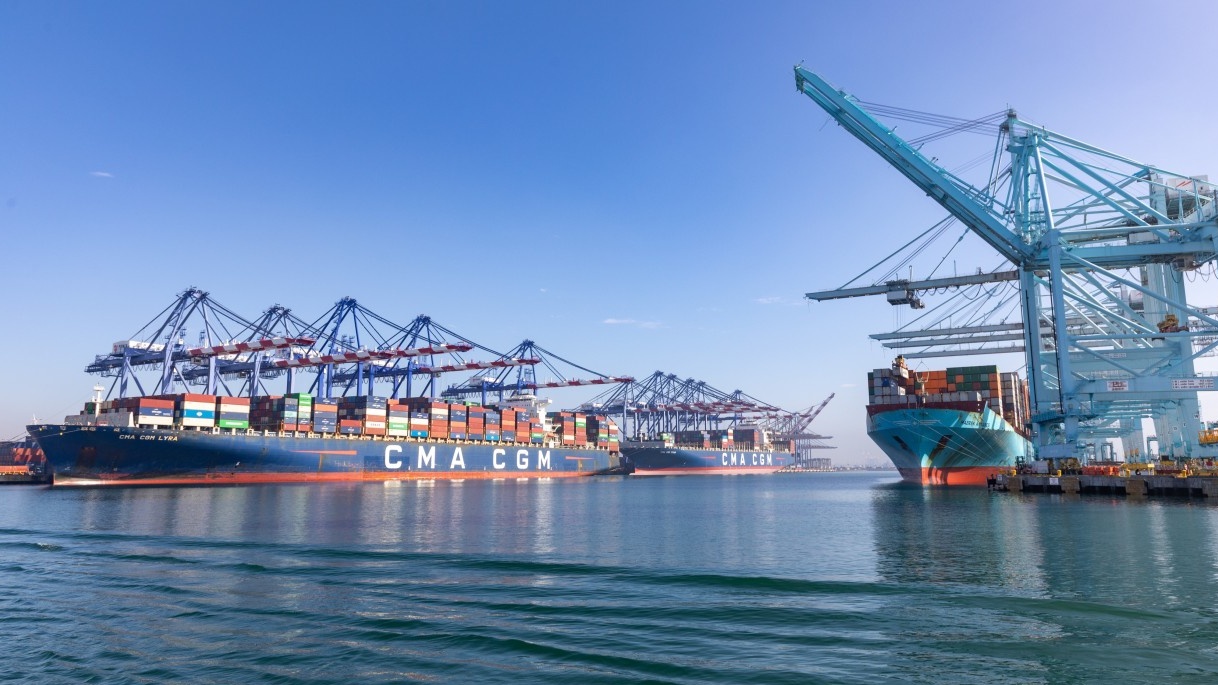
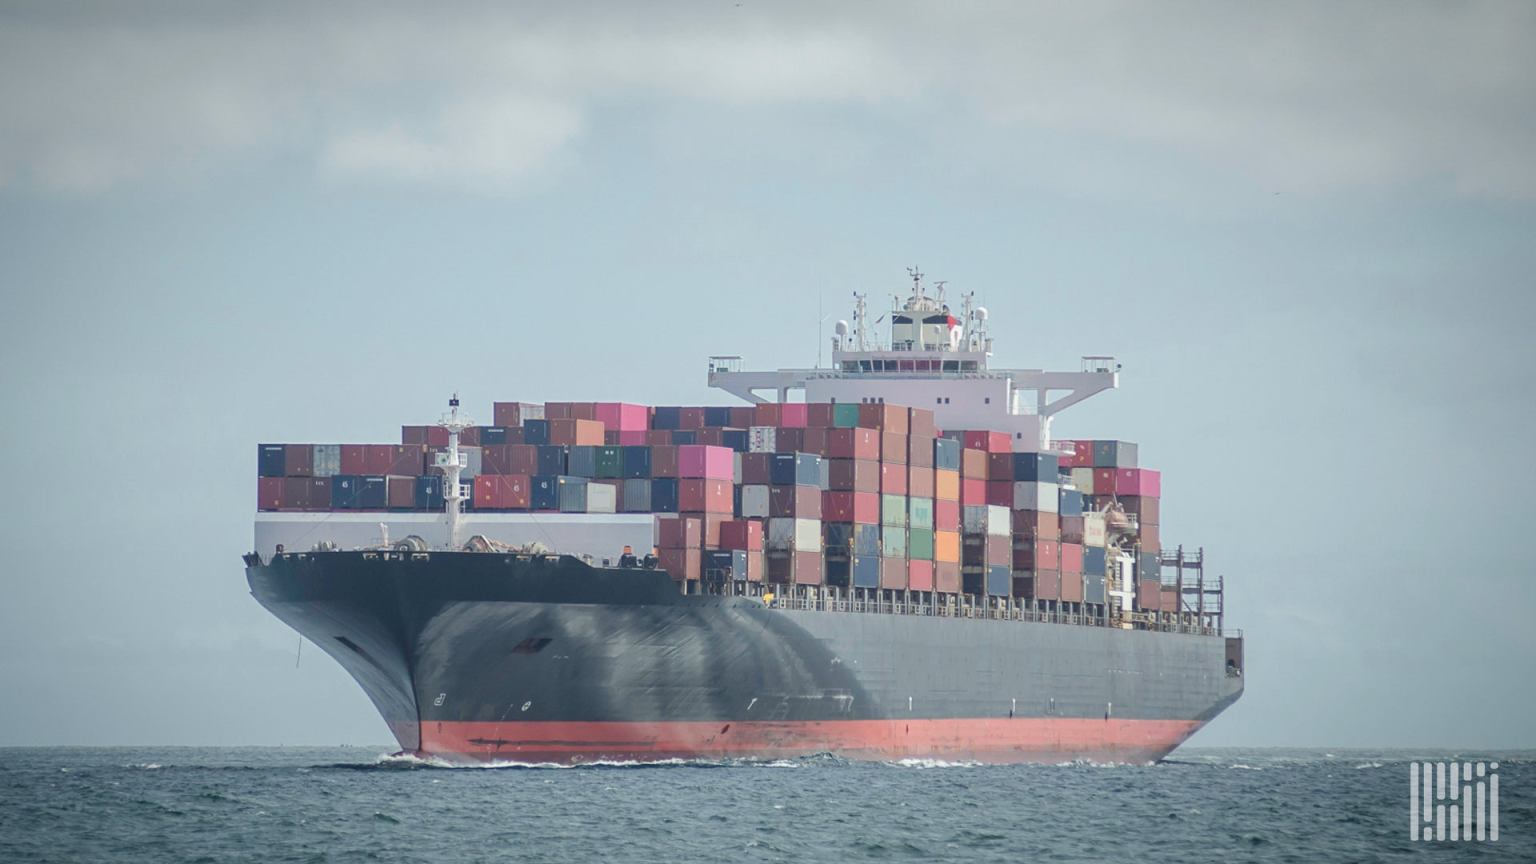
Global container port congestion has climbed beyond the levels recorded during the Covid era, removing more than 4.3m teu of capacity from circulation and helping keep freight and charter rates elevated, according to Splash247.
Congestion tops pandemic record
Data from Linerlytica shows 4.3m teu is now waiting to berth at container ports worldwide, surpassing the previous absolute peak of 4m teu recorded during the pandemic earlier in the 2020s — a period Splash247 described as the most profitable decade in the history of containerisation.
The comparison comes with an important caveat. Congested tonnage today represents 12.6% of the 34.4m teu global fleet, below the 15.7% peak reached in 2022, when the fleet totalled just 25.3m teu. In other words, the absolute volume of delayed capacity is a record, even though the share of the world fleet affected is thinner than in 2022.
| Metric | Covid-era peak | Current (August 2026) |
|---|---|---|
| TEU waiting to berth | 4.0m | 4.3m |
| Congested tonnage as % of global fleet | 15.7% | 12.6% |
| Global container fleet | 25.3m teu | 34.4m teu |
East Asia drives the spike
East Asia is driving much of the latest surge after successive tropical storms disrupted Chinese port operations and vessel schedules. Portcast data cited by Splash247 this week showed 139 vessels waiting at Shanghai and another 77 at Ningbo, both at highs not seen during 2025 or 2026.
Waiting times at Shanghai’s Yangshan terminals have stretched to five or six days for Gemini services and as much as seven or eight days for other carriers. Sea-Intelligence, using a different methodology, estimates delays are currently removing around 1.7m teu of effective vessel capacity from the market. Schedule reliability remains stuck at around 60-65%, while late ships are arriving an average of five to five-and-a-half days behind schedule, versus three to four days before the pandemic.
Freight rates keep climbing
The capacity squeeze is providing another prop beneath freight markets already inflated by the Iran war and widespread disruption to normal liner networks. Linerlytica calculates the Shanghai Containerized Freight Index (SCFI) is now 156% higher than when the Iran conflict began. The SCFI gained again last week to around 3,355 points.
Other benchmarks underline the pressure. S&P Global’s Platts Container Index jumped to $7,565 per feu on August 21, its highest level this year, with analysts citing typhoon-related Asian port delays, space shortages and Panama Canal restrictions. Freightos has similarly identified congestion as an increasingly important driver of freight rates.
Panama Canal restrictions loom
More disruption is looming in Panama. The canal will cut available daily transit slots from September as below-normal rainfall forces fresh water-saving measures. Neopanamax slots will fall to nine a day from September 3, with total panamax availability dropping further from September 15. The resulting shortage of ships is also feeding into the containership charter market, where tonnage remains scarce and demand strong, according to Splash247.
What this means for shippers and forwarders
For freight forwarders, 3PL operators and shippers, the direct operational impacts are visible in the data: SCFI is around 3,355 points, Platts Container Index is at $7,565 per feu, and schedule reliability is stuck at 60-65% with late ships arriving five to five-and-a-half days behind schedule. With 4.3m teu waiting to berth globally and 139 vessels outside Shanghai plus 77 outside Ningbo, port waiting times will remain a major constraint on cargo movement.
The Panama Canal transit cuts starting September 3 and September 15 will tighten capacity on any service using the canal, particularly neopanamax routes. Shippers should factor the reduced daily slot availability into transit time expectations, while forwarders may need to re-route or adjust booking cut-offs on services that rely on Panama.
Watch list
- Panama Canal slots: Neopanamax slots drop to nine per day from September 3; panamax availability falls further from September 15.
- Port queues at Shanghai and Ningbo: Waiting lists of 139 and 77 vessels respectively suggest tropical storm disruption persists.
- Freight rate momentum: SCFI gained last week to ~3,355; Platts index at $7,565 per FEU.
- Charter market: Tonnage remains scarce and demand strong, pushing charter rates higher.
- Iran war impact: Freight markets remain inflated by the conflict, which continues to disrupt normal liner networks.
Sources: