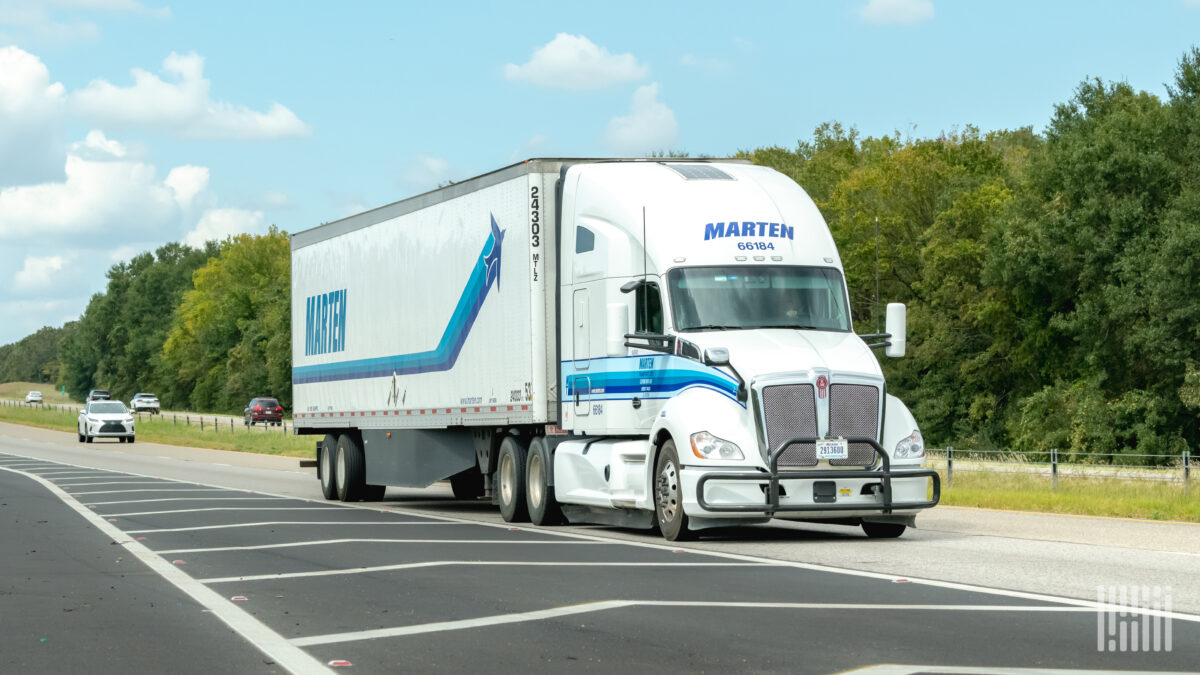
Refrigerated carrier Marten Transport (NASDAQ: MRTN) reported second-quarter results Thursday that signal a significant firming in truckload fundamentals, allowing the company to improve freight selection and raise rates as capacity tightens sharply.
“The freight market has sharply tightened in recent months and is now breaking out from the longest freight market recession on record,” stated CEO Randy Marten in a news release. He attributed the shift to a regulatory crackdown that is “contracting meaningful levels of freight capacity by removing noncompliant and unqualified drivers.”
Capacity Tightening Drives Rate Increases
The Mondovi, Wisconsin-based company reported an 8% decline in average tractors in service in its non-dedicated truckload (TL) fleet, but that was offset by a 9% increase in revenue per tractor and a 6% rise in revenue per loaded mile to $2.81. Revenue from the non-dedicated TL fleet increased 9% year-over-year to $116 million (flat at $93 million excluding fuel surcharges). The unit posted a 97.4% operating ratio (ex-fuel), which improved 10 basis points year-over-year.
Segment Performance Overview
The following table summarizes year-over-year changes in key metrics across Marten’s operating segments:
| Segment | Revenue (ex-fuel) | Truck Count | Revenue per Tractor | Revenue per Loaded Mile | Operating Ratio (ex-fuel) |
|---|---|---|---|---|---|
| Non-dedicated TL | Flat | -8% | +9% | +6% ($2.81) | 97.4% (10 bps better) |
| Dedicated | -14% | -17% | +3% | -5% ($2.36) | 95.4% (430 bps worse) |
| Brokerage | Flat ($40M) | N/A | N/A | -2% per load | 94.8% (160 bps worse) |
Dedicated segment revenue (ex-fuel) declined 14% year-over-year as a 17% drop in truck count was only partially offset by a 3% increase in revenue per tractor. Revenue per loaded mile fell 5% to $2.36, and the operating ratio worsened 430 basis points to 95.4%.
Brokerage revenue remained flat at $40 million, with a 2% increase in loads offset by a 2% decline in revenue per load. The segment’s operating ratio worsened 160 basis points to 94.8%, though the company noted this compares favorably to other brokerages given that third-party capacity buy rates are much higher than in-place sell rates on contractual business due to the rapid run-up in the spot market.
Consolidated Results and Cash Flow
Consolidated revenue of $224 million was 3% lower year-over-year and $4 million short of consensus. Earnings per share came in at 7 cents (net income of $5.3 million), down 2 cents year-over-year and a penny light of estimates. The sale of its intermodal unit to Hub Group (NASDAQ: HUBG) in 2025 created an $11.7 million revenue headwind during the quarter. Earnings per share faced a 3-cent headwind due to a $3.5 million drop in gains on equipment sales.
Cash flow from operations was $61 million for the first half of 2026, a 12% decline year-over-year. The company maintained a debt-free balance sheet in the quarter. The average age of its tractor fleet increased to 2.5 years from 2.1 years in the year-ago period.
Shares of MRTN were off 2% in early trading Friday compared to the S&P 500, which was off 0.1%.
Implications for Shippers and Operators
As the only publicly traded pure-play refrigerated carrier, Marten Transport’s results serve as a bellwether for the reefer market. The combination of declining truck counts, rising rates per loaded mile, and tighter capacity indicates that shippers should expect higher spot and contract rates for refrigerated freight in the coming months. The regulatory environment is removing noncompliant drivers, further constraining capacity. Freight forwarders and 3PLs should anticipate tighter availability and extended lead times in the reefer segment, particularly for lane coverage historically served by smaller, less compliant carriers.
Watch List
- Regulatory enforcement: Continued FMCSA crackdowns on driver qualifications and compliance may accelerate capacity removal.
- Spot market trends: The rapid rise in third-party capacity buy rates suggests spot rates may continue to outpace contract rates, pressuring broker margins.
- Equipment sales: Lower gains on equipment sales could pressure earnings if the used truck market softens.
- Intermodal competition: The sale of Marten’s intermodal unit to Hub Group reduces one mode-shift option for shippers, potentially increasing truckload demand.
Sources: