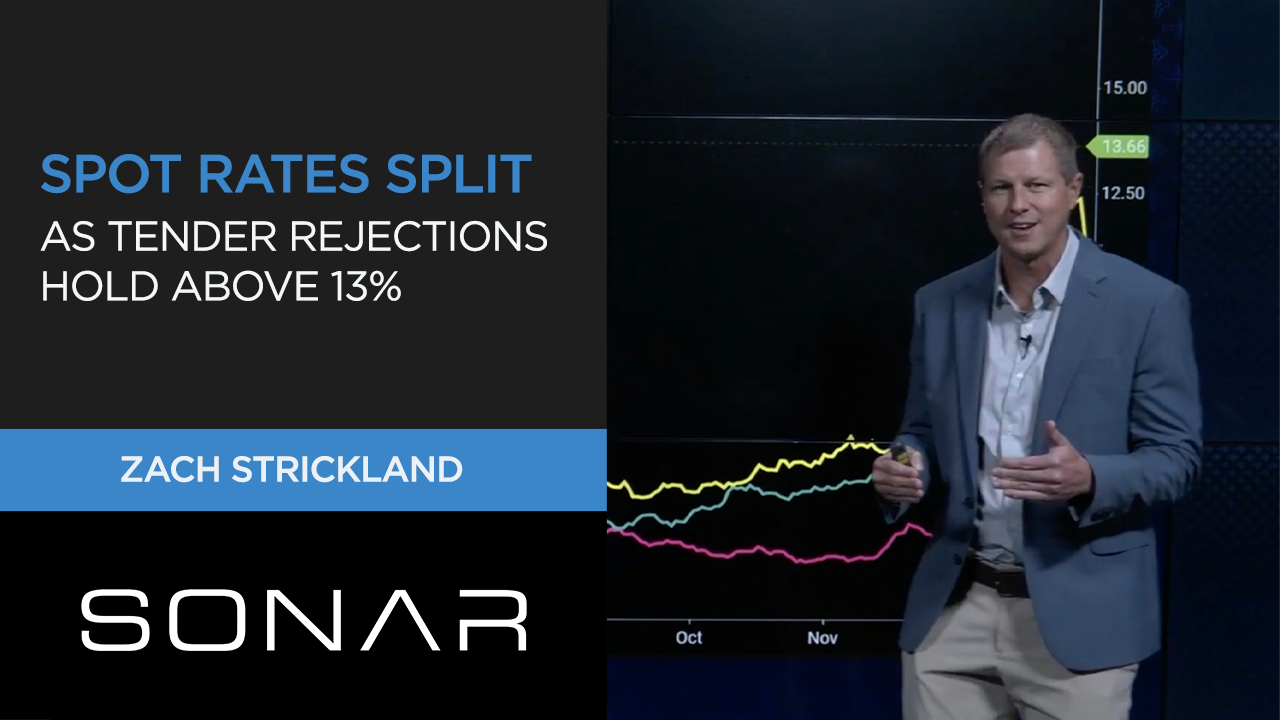
Truckload tender rejections have stalled at 13.5%, more than double the 5% to 7% range considered a balanced market, but a faster-than-expected demand pullback and a measurable shift toward intermodal are beginning to pressure dry van spot rates, according to Zach Strickland's latest SONAR update published by FreightWaves. Rejection rates sat near 5.5% one year ago, and anything above the 10% threshold makes it "extremely challenging for most shippers to find capacity," Strickland said.
The current stall around 13.5% signals a still-tight market, but a trendline that formed in June had been pointing toward an eventual return to equilibrium in the 5% to 7% range — and demand has been eroding faster than seasonal norms suggest it should. "One of the reasons for that, because we're in a supply-side-led cycle, demand has really fallen down faster than we expected, especially from a seasonality standpoint," Strickland said in the SONAR update. The tender volume index, which measures shipper-to-carrier load tenders, has fallen below April levels — a notable drop given that April is itself a slow month and July typically only moderates modestly from June, according to the report.
Rejections Stuck at 13.5% as Demand Pullback Outpaces Seasonality
Strickland's data shows a rejection rate that has stalled near 13.5%, more than double the 5% to 7% benchmark that defines a balanced truckload market. The reading is down from roughly 5.5% a year ago, but remains above the 10% threshold that makes capacity extremely challenging for shippers to secure, he said. A trendline that formed in June suggested the market was heading back toward equilibrium in the 5% to 7% band, yet demand has decayed faster than typical seasonal patterns, per the SONAR update. The tender volume index has slipped below April levels, an unusual development because April is normally a slower month and July generally eases only modestly from June.
Modal Shift: Intermodal Volumes Outpace Long-Haul Truckload
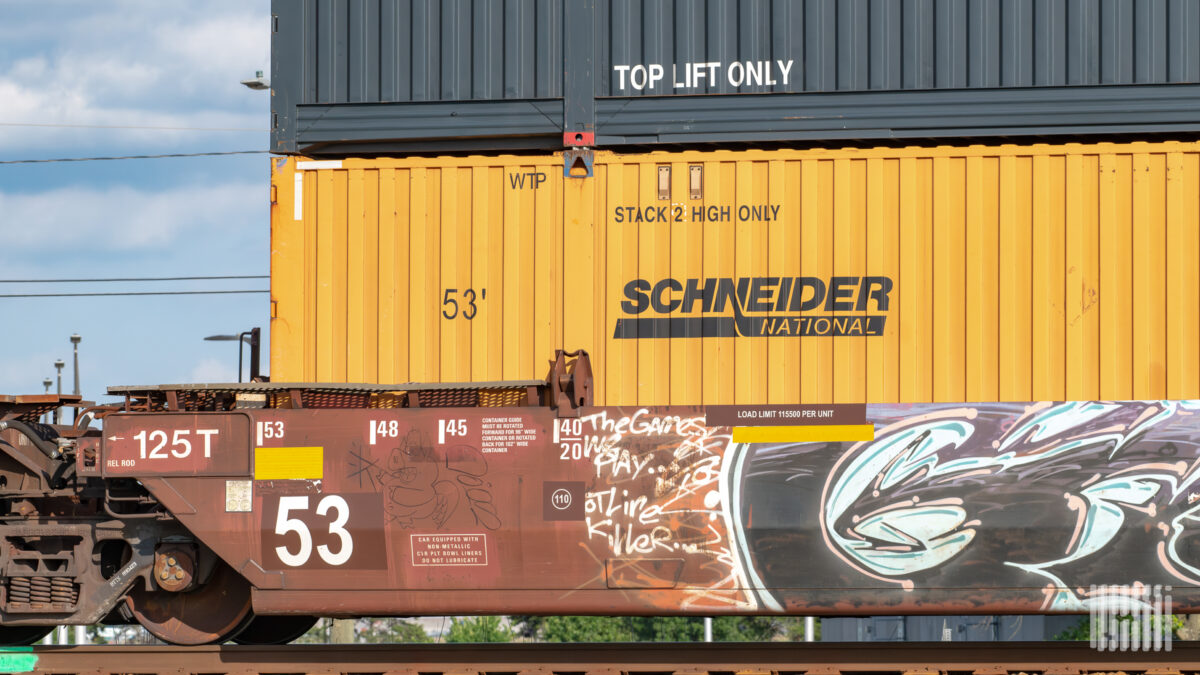
A widening divergence between long-haul truckload and domestic intermodal is driving the softening dry van picture, Strickland said. Long-haul truckload tender volumes are up just 2% year over year, while domestic intermodal container volumes have climbed 8% year over year.
We're seeing almost a mirror image of replacement. — Zach Strickland, describing the divergence between long-haul truckload and domestic intermodal container volumes
Short-haul tender volumes — loads under 100 miles — are up 4% year over year, outpacing long-haul. That resilience is evidence the truckload cycle is not nearing an early end, according to Strickland, and short-haul freight is the segment least susceptible to intermodal substitution.
Spot Rates Diverge: Flatbed, Reefer and Dry Van
On the spot rate side, a three-way spread is opening among the modes. Flatbed remains the strongest, supported by AI data center construction activity, though rates have begun to edge lower, Strickland reported. Refrigerated spot rates, which had been moving nearly in lockstep with dry van, are now separating to the upside. Dry van, the mode most exposed to intermodal competition, is pulling back and would show a largely red — declining — national rate map, he said.
| Mode | Year-over-year tender volume change | Spot rate direction |
|---|---|---|
| Long-haul truckload | +2% | Pulling back; red national map for dry van |
| Domestic intermodal | +8% | N/A — modal shift accelerates |
| Short-haul truckload (<100 miles) | +4% | Firm |
| Refrigerated | Not specified | Upside separation from dry van |
| Flatbed | Not specified | Strongest, edging lower |
Midwest Reefer Rates Spike in Protein and Grain Corridors
Midwestern rejection rates spiked earlier this week, and the same pattern is now showing up in refrigerated spot rates, with increases concentrated in protein and grain corridors, according to Strickland. He flagged the move as early for a harvest-driven rate increase and named the region one to watch for carriers and shippers active in temperature-controlled freight.
What Shippers and Carriers Should Watch
For shippers buying capacity, the data indicates dry van loads are the most exposed to intermodal competition, while short-haul freight remains the least susceptible to modal substitution, according to the report. With rejections above the 10% threshold, finding capacity remains difficult, but the softening demand trend and the June-forward trendline point toward eventual easing. The report also promoted the Brokerage Compliance Symposium, scheduled for the day before F3, covering fraud exposure, carrier liability, FMCSA rules, cargo theft and insurance gaps. Strickland's setup — tight rejections, a modal shift, a three-way spot rate split and early Midwest reefer pressure — suggests a complicated second half of summer for truckload pricing and capacity planning.
Sources: