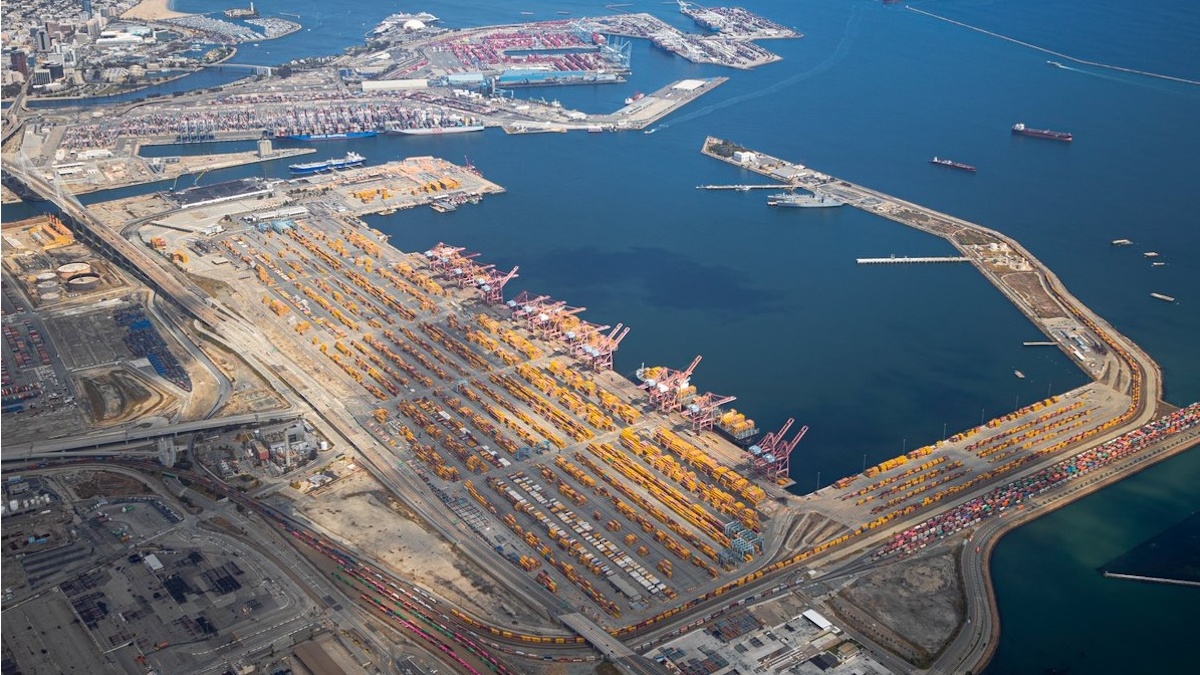
The Port of Long Beach handled 928,508 TEUs in July, its second-busiest July on record and the fourth-strongest month in the port's 115-year history, according to FreightWaves. The throughput marks the beginning of an extended peak season that analysts now expect to stretch into September.
Why volumes are rising
FreightWaves reported that analysts attribute the surge to surprising consumer resilience amid inflation and higher prices, with cargo demand holding up despite cost pressures. The National Retail Federation has revised its summer import forecast to steady, elevated gains, and ocean carrier Maersk (OTC: AMKBY) raised its full-year guidance on Thursday for the second time — two signals that the current momentum could carry deep into the third quarter.
July throughput at a glance
Long Beach, which together with the adjoining Port of Los Angeles comprises the top San Pedro Bay import gateway, moved 928,508 twenty-foot equivalent units (TEUs) in July, down 1.7% from the same month in 2025. The import side was essentially flat, slipping 0.1% to 467,461 TEUs, while exports jumped 14.8% to 104,843 TEUs. Empty containers, frequently an indicator of future import demand, fell 7.4% to 356,205 TEUs.
| Metric | July 2026 | Change vs. July 2025 |
|---|---|---|
| Total throughput | 928,508 TEUs | -1.7% |
| Imports | 467,461 TEUs | -0.1% |
| Exports | 104,843 TEUs | +14.8% |
| Empty containers | 356,205 TEUs | -7.4% |
| Year-to-date total (Jan–Jul) | 5,758,086 TEUs | +1.2% |
The year-to-date performance also remains firmly positive: Long Beach processed 5,758,086 TEUs through the first seven months of 2026, a 1.2% gain year over year, according to FreightWaves.
Key finding: Long Beach's July throughput was down 1.7% year over year, yet still ranked as the port's second-busiest July and fourth-strongest month in its 115-year history.
Implications for shippers and operators
For freight forwarders, 3PLs, drayage providers, and ocean carriers, the July numbers point to a few operational realities:
- Export capacity is expanding. Outbound volumes rose 14.8% year over year to 104,843 TEUs, giving exporters more booking options on the transpacific lane.
- Import volumes are holding steady. At 467,461 TEUs, imports slipped just 0.1%, suggesting sustained inbound demand even with inflation pressuring consumer budgets.
- Empty repositioning is tightening. The 7.4% drop in empty containers could reduce the pool of boxes available for export loads at inland points, a factor worth watching for cargo availability.
- Year-to-date growth is intact. A 1.2% cumulative gain through July indicates the gateway is operating above last year's levels, which may translate into longer gate queues and tighter chassis supply during peak windows.
The record-setting monthly performance — second only to the best July ever in the port's history — reinforces that the San Pedro Bay gateway remains the dominant entry point for trans-Pacific containerized trade, according to FreightWaves.
Watch list
- Whether the expected September peak season extends beyond current forecasts.
- How the falling empty-container count affects repositioning and chassis availability at San Pedro Bay terminals.
- Whether Maersk's second guidance raise of the year prompts rival carriers to adjust capacity in the transpacific market.
- How Long Beach's August throughput responds to elevated consumer demand, with the National Retail Federation's revised forecast pointing to steady, elevated gains.
Sources: