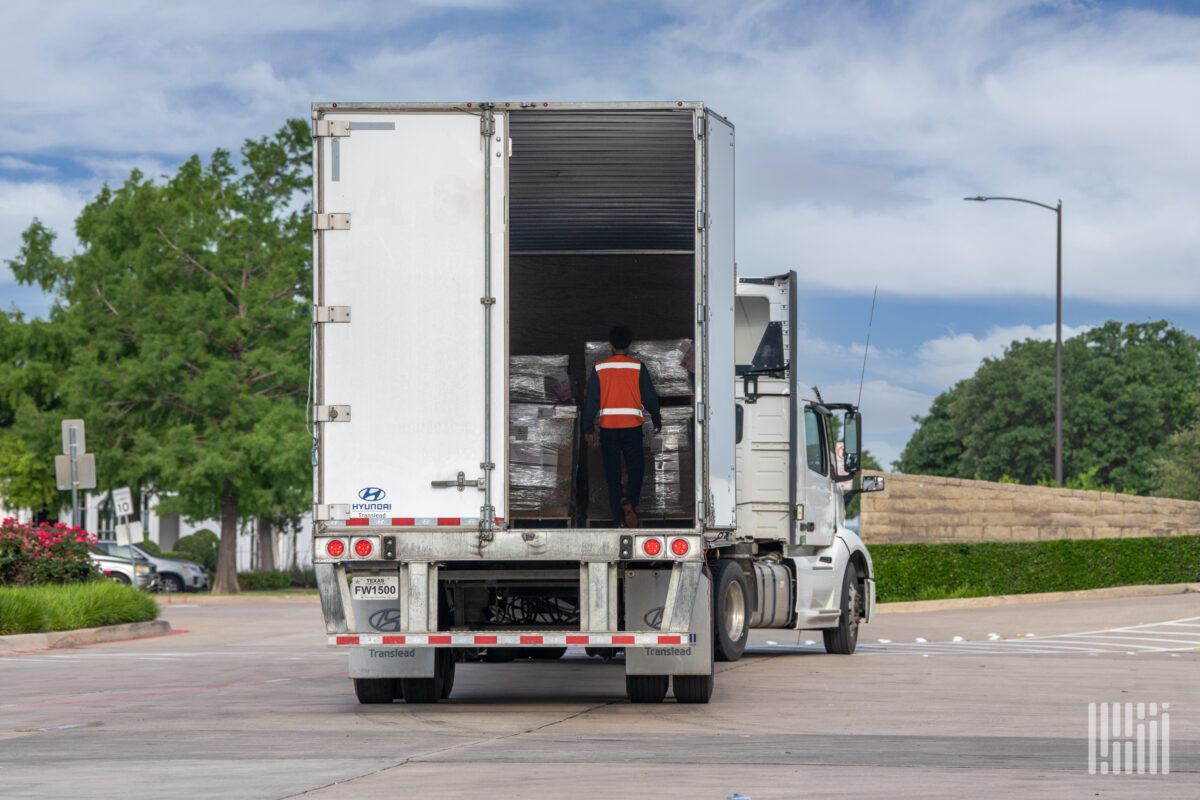
Spot rates in the trucking industry are finally rising — roughly 15% above year-ago levels in mid-2026, the strongest year-over-year comparison since early 2022, according to a FreightWaves analysis by Adam Wingfield. A load that paid $2,200 last year now pays $2,500 or $2,600. But the cash-flow reality is far less rosy: diesel costs remain high, truck payments are unchanged, insurance has not dropped, and operators still wait 35 to 40 days for payment unless they factor their receivables. "A bigger number at the end of a 35-day wait beats a smaller one. It is not the same thing as having cash this week," Wingfield writes.
The Cost Stack That Showed Up Before the Rates Did
The real danger, the article explains, is that the costs absorbed during the 2023–2024 downturn never receded. The American Transportation Research Institute's (ATRI) 2025 Operational Costs of Trucking report put the average all-in cost to run a truck at $2.26 per mile in 2024. Backing out fuel, the marginal cost hit $1.78 per mile — the highest non-fuel operating cost ATRI has ever recorded. The cost of everything except diesel set an all-time record.
Key line items from the ATRI report show where the money went:
| Cost Category | Cost per Mile (2024) | Year-over-Year Change | Change Since 2019 |
|---|---|---|---|
| Truck and trailer payments | $0.39 | +8.3% | +52.3% |
| Driver wages | $0.78 | — | — |
| Total driver compensation | $0.97 | — | — |
| Repair and maintenance | ~$0.20 | Dipped in 2024, climbing in 2025 due to tariffs | — |
According to ATRI, truck and trailer payments experienced "no equal for radical cost upheaval," rising 52.3% since 2019. The truckload sector posted an average operating margin of negative 2.3% in 2024, meaning the average carrier lost money on every mile. "That is the cost structure you are carrying into this recovery whether you have measured it or not," Wingfield warns.
The Two Line Items Proving the Point: Labor and Insurance
The clearest evidence that rising rates do not guarantee profit comes from two cost categories that keep climbing regardless of market conditions: labor and insurance.
Labor: Total driver compensation reached $0.97 per mile, with wages alone at $0.78. Bureau of Labor Statistics data shows truck transportation wages above $30 per hour over the past year. Pressures are intensifying due to new CDL restrictions and English-language proficiency enforcement, which are projected to reduce the qualified driver pool, keeping wage growth elevated through 2026. For owner-operators, the question becomes whether the rate leaves a real wage after all other expenses are covered.
Insurance: While specific numbers are not detailed in the source, insurance costs continue to climb irrespective of rate movements, further squeezing margins.
The Trap of Complacency
A high rate hides a bad operation but does not fix it, Wingfield argues. When the market is hot, operators with bloated breakeven costs and sloppy habits still profit and never address the underlying problems. When rates cool back toward breakeven, the same decisions that were invisible at $2.60 a mile become fatal at $2.20 a mile. "The rate bought him time. It did not buy him a business," he writes.
The operators who survive are those who use a strong market to fix their cost structure. Those who use it to outrun their own decisions are simply "running up a bigger tab for later."
Implications for the Industry
For C-suite executives and investors tracking the transportation sector, the message is clear: rising top-line revenue from spot rates does not automatically translate into bottom-line health. The cost base — particularly equipment payments, labor, and insurance — remains structurally higher than pre-pandemic levels. Carriers that fail to address operational efficiency risk being caught when the next downturn hits. The ATRI data provides a benchmark against which individual companies should measure their own cost per mile.
As the market continues to recover, the winners will be those who treat the rate improvement as an opportunity to strengthen their balance sheets and operating models, not just as a relief from cash-flow pressure.
Sources: