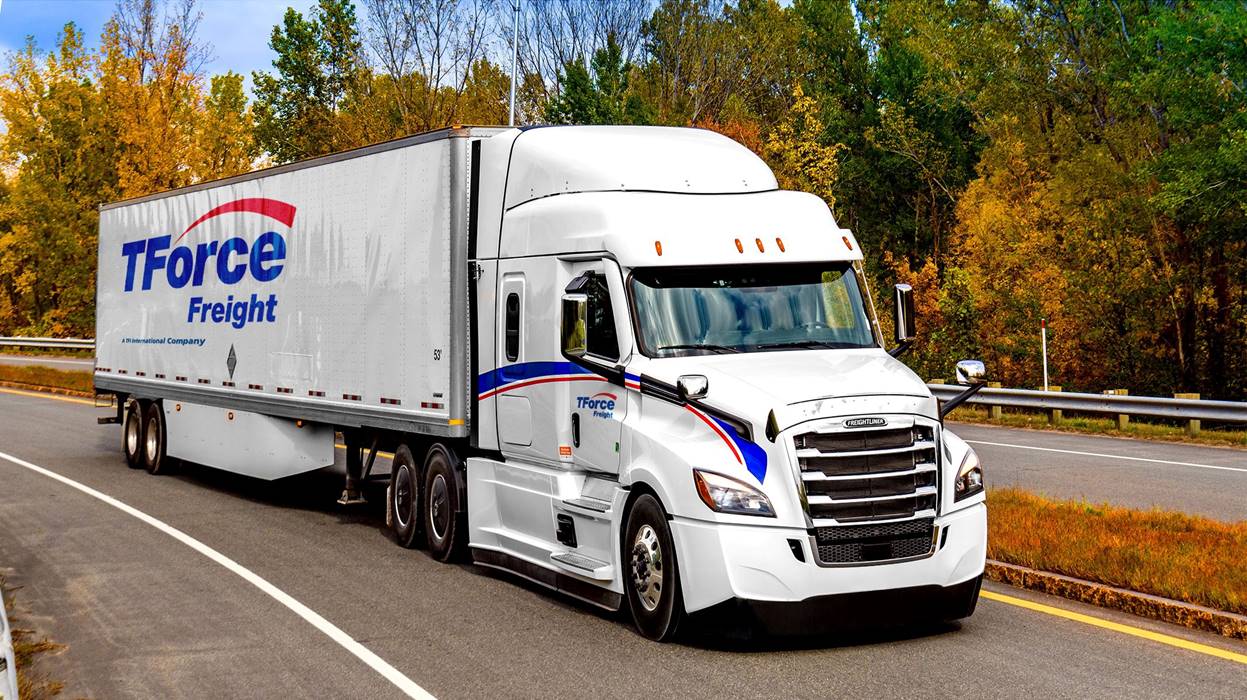
TFI International's truckload segment outpaced its less-than-truckload (LTL) operations in the second quarter of 2026, with double-digit revenue growth and a sharp drop in its operating ratio (OR), according to FreightWaves.
Truckload Segment Shines
Truckload revenue for TFI International (NYSE: TFII) rose 12.6% year-over-year in Q2 2026, FreightWaves reported. Adjusted EBITDA increased 14.75%, and the operating ratio improved by 400 basis points to 86.1% (lower OR indicates higher profitability). Revenue per truck per week excluding fuel jumped 21.6%.
LTL Performance Lags
LTL results were mixed. The OR worsened by 100 basis points, revenue per hundredweight excluding fuel — a key LTL benchmark — fell slightly, and revenue per shipment excluding fuel dropped 2.1%, according to FreightWaves. However, adjusted EBITDA still rose 4.46%.
| Metric | Truckload | LTL |
|---|---|---|
| Revenue change YoY | +12.6% | N/A (not directly reported) |
| Adjusted EBITDA change YoY | +14.75% | +4.46% |
| Operating ratio (OR) | 86.1% (improved 400 bps) | Worsened 100 bps |
| Revenue per truck/week (ex-fuel) | +21.6% | N/A |
| Revenue per hundredweight (ex-fuel) | N/A | Fell slightly |
| Revenue per shipment (ex-fuel) | N/A | -2.1% |
| Adjusted EBITDA margin | 24.1% | 18.0% |
Overall Financial Strength
TFI's overall net income rose to $136.2 million from $98.2 million in the year-ago quarter, FreightWaves noted. Adjusted earnings per share climbed to $1.86 from $1.34.
The company's revenue mix shifted over the six months ended June 30, 2026. Manufactured goods rose to 19% of revenue (from 17% a year earlier), retail fell to 16% (from 19%), and automotive increased to 13% (from 10%).
Equipment Count Declines Significantly
One notable statistic: TFI's equipment count dropped sharply. At the end of June 2026, the company had 11,987 trucks, 39,710 trailers, and 6,189 independent contractors. A year earlier, the corresponding numbers were 13,511 trucks, 42,726 trailers, and 6,044 independent contractors. The reduction in company-owned trucks and trailers — down 1,524 units and 3,016 units respectively — suggests a strategic shift or capacity pullback that could tighten road freight availability for shippers.
Shipper and Operator Implications
For logistics managers and 3PL operators, TFI's results highlight diverging trends in truckload versus LTL markets. The strong truckload performance — with double-digit revenue per truck gains — indicates robust demand in that mode, possibly driven by the shift toward manufactured goods and automotive sectors. Conversely, the LTL segment's weaker metrics (lower revenue per shipment, OR deterioration) may signal pricing pressure or cost increases. The equipment reduction across TFI's fleet could constrain capacity, potentially leading to higher spot rates for truckload services in the coming quarters.
Sources: